Math Illustrations Tips

March 2011
Three more tips to help you get the most out of Math Illustrations.

Every so often, we are asked about piecewise functions, and have to answer "No, we don't have piecewise functions".  But we show you here a tip on how to mimic a single piecewise function with several limited domain functions.

When you constrain, measure or annotate an angle, Math Illustrations chooses which quadrant to use.  We'll show you how to change the quadrant.

We'll also answer a question we're frequently asked, "What is the difference between Math Illustrations and Geometry Expressions?"
piecewise function Piecewise Functions
Math Illustrations does not have a piecewise function.  But it does have limited domain functions, which can be used to draw a piecewise function.

For example, to create a graph of the piecewise function

    f(X) = X      X<1
             X^2  X>1
  • Create the function f(X)=X with domain start, say, -10 and domain end 1
  • Create the function f(X)=X^2 with domain start 1 and domain end, say 10. 
  • Hide the function names and create a new combined function name as annotations. 

OK, a bit more work than we'd like, but at least it gives you something until the next version of Math Illustrations is released, which will have piecewise functions, we promise.

interior angle Exterior Angles  [Video]
When you measure the angle between two lines, Math Illustrations chooses 
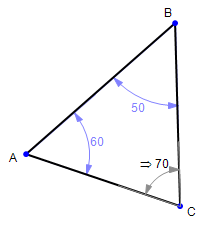
which of the four possible quadrants to use.  For a triangle, it always chooses the interior angle.

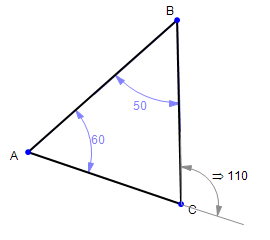
What if you want to display the exterior angle?

This is easy: simply grab hold of the arc which forms the angle symbol and drag it until it's in the exterior position.

For a measurement, Math Illustrations will automatically recompute the angle's measure.

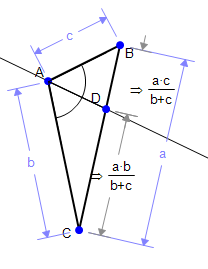
You can also drag a constraint into a different quadrant.   

In this case, Math Illustrations will change

exterior angle

the geometry to match the new constraint - if the constraint is numeric.  If the constraint is a variable, then Math Illustrations will keep the geometry, but alter the numeric value of the variable.

And of course, you can drag an angle annotation, with no effect on its value.


Angle bisector Geometry Expressions [Videos]
What is the difference between Math Illustrations and Geometry Expressions?

Geometry Expressions contains all the features of Math Illustrations, plus one additional (very powerful) feature: it can generate algebraic measurements from the drawing as well as numeric measurements.

If you download the Geometry Expressions Demo, you'll find its user interface extremely similar to Math Illustrations.  The major difference being the addition of Symbolic/Real tabs to the Calculate panel.

The ability to generate algebra from the geometry is a unique feature of Geometry Expressions and makes it a powerful tool for mathematical modeling.  Once you have generated an algebraic expression, it can be copied from Geometry Expressions and pasted into a number of different CAS systems, as well as MathType.

One further tip: Math Illustrations can read in Geometry Expressions files.  So if you download a Geometry Expressions file from, for example, the Geometry Atlas, just type it in (along with the .gx extension) and you can read it into Math Illustrations. You'll see the algebra that is already there, you just won't be able to create any more!