Math Illustrations Tips

December 2010
One of the attributes of a good piece of software is that it gets used for things it was not specifically designed for.

In this issue of Tips & Tricks, we'll highlight three such uses of Math Illustrations
  • Creating a Venn diagram.
  • Drawing a mapping diagram.
  • Creating a pseudo-3D picture of a hyperboloid.
     
Venn diagram using transparency Venn Diagram [Video]
For a symmetric looking Venn diagram, you would like 3 equally sized and spaced circles. 
  • Start by creating a triangle, whose vertices will be the centers of the circles.
     
  • Select the three sides and use Constrain / Congruent
  • Draw circles centered at the vertices of the triangle.
     
  • One at a time select each circle and use Constrain / Radius.  Specify the radius of each to be r.
  • Dragging one circle's circumference point now changes r and the size of all 3 circles.
  • Select the original triangle, along with the radius constraints and any points you do not wish to show up in the picture and use View / Hide.
     
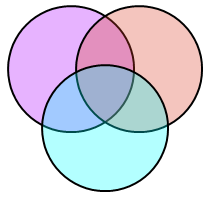
Having drawn the circles, set the properties of each so that it has a different fill color, and is, say, 70% transparent. Transparency will automatically give different colors for the intersection regions.

Note that if you use transparency, when you copy into Word on a PC, you should Paste As a bitmap, as Windows Metafiles do not handleVenn diagram using polygon transparency.

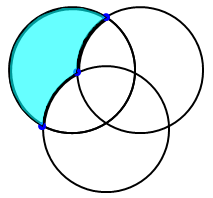
If you want to highlight only a single region, you use a different technique:
  • Use Draw / Point and ensure both circles are highlighted to create points at the appropriate intersections.
  • Use Draw / Arc and drag from one point along the appropriate circle to the other to create arcs between these points
  • Select the arcs and use Construct / Polygon
     
Mapping diagram Mapping Diagram [Video]
  • Start your mapping diagram with an ellipse.
  • Select the ellipse and use Construct /Translation to create a second copy, translated horizontally.
  • Add some points inside the ellipses.
  • Double click on the points' labels and edit
  • Add vectors, or line segments between the points.
     
hyperboloid Hyperboloid [Video]
Imagine taking two circular rings (in 3D), and joining corresponding points with pieces of string of equal length. Hold one ring and let the other hang from the string. The pieces of string all lie on a cylindrical surface.

If you now hold the bottom ring and rotate it, the strings will twist and form a surface known as a hyperboloid of one sheet.

Drawing this in Math Illustrations relies on the fact that the "point proportional along a curve" constraint when applied to a point on an ellipse is equivalent to putting a point at the specified angle on a circle, then tilting the circle (in 3D) until it looks like the ellipse.

To model the hyperboloid:
  • Draw an ellipse.
  • Select the ellipse and use Construct / Translation to create a second copy by translating it perpendicular to its axis.
  • Put a point on the first ellipse and use Constrain / Proportional, setting its proportional location to be t.
  • Put a point on the second ellipse and constrain its proportional location to be t+k.
  • Draw a line segment between the points.
  • Select the line segment and use Construct / Trace.
  • Specify t as the parameter and make it run from 0 to 6.28